

PUBLICATIONS LIST
*Corresponding author
60. Zhou, Y., Lu, Y.*, Wei, D., & He, S. (2024). Impacts of social deprivation on mortality and protective effects of greenness exposure in Hong Kong, 1999–2018: A spatiotemporal perspective. Health & Place, 87, 103241. (Click for full text of PDF)

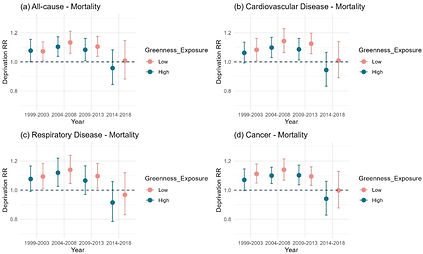
Addressing health inequality is crucial for fostering healthy city development. However, there is a dearth of literature simultaneously investigating the effects of social deprivation and greenness exposure on mortality risks, as well as how greenness exposure may mitigate the adverse effect of social deprivation on mortality risks from a spatiotemporal perspective. Drawing on socioeconomic, remote sensing, and mortality record data, this study presents spatiotemporal patterns of social deprivation, population weighted greenness exposure, and all-cause and cause-specific mortality in Hong Kong. A Bayesian regression model was applied to investigate the impacts of social deprivation and greenness exposure on mortality and examine how socioeconomic inequalities in mortality may vary across areas with different greenness levels in Hong Kong from 1999 to 2018. We observed a decline in social deprivation (0.67–0.56), and an increase in greenness exposure (0.34–0.41) in Hong Kong during 1999–2018. Areas with high mortality gradually clustered in the Kowloon Peninsula and the northern regions of Hong Kong Island. Adverse impacts of social deprivation on all-cause mortality weakened in recent years (RR from 2009 to 2013: 1.103, 95%CI: 1.051–1.159, RR from 2014 to 2018: 1.041 95%CI: 0.950–1.139), while the protective impacts of greenness exposure consistently strengthened (RR from 1999 to 2003: 0.903, 95%CI: 0.827–0.984, RR from 2014 to 2018: 0.859, 95%CI: 0.763–0.965). Moreover, the adverse effects of social deprivation on mortality risks were found to be higher in areas with lower greenness exposure. These findings provide evidence of associations between social deprivation, greenness exposure, and mortality risks in Hong Kong over the past decades, and highlight the potential of greenness exposure to mitigate health inequalities. Our study provides valuable implications for policymakers to develop a healthy city.
59. Jiang, Y., Liu, D., Ren, L., Grekousis, G., & Lu, Y.* (2024). Tree abundance, species richness, or species mix? Exploring the relationship between features of urban street trees and pedestrian volume in Jinan, China. Urban Forestry & Urban Greening, 95, 128294. (Click for full text of PDF)


Accumulating evidence has confirmed that urban greenery, especially street trees, is beneficial to walking behaviors. Existing street greenery exposure-walking behavior studies have focused on the quantity of greenery, which is often measured by normalized difference vegetation index (NDVI) or green view index (GVI). However, some important qualities of street trees, the dominant component of urban greenery, were often overlooked, due to the labor-intensive and expensive nature of on-site surveys. To address this issue, we proposed a cutting-edge deep learning technique to identify street tree species at the individual tree level. We established a citywide dataset of all street trees with species information via 185,831 Baidu Street View images (BSV) in Jinan, China. Population-level walking intensity, measured by pedestrian volume, was retrieved from BSV images using Baidu AI. We further adopted spatial regression models to investigate the association between pedestrian volume and street tree characteristics, including street tree abundance (number of street trees), species richness (number of unique tree species) and species mix (the degree of diversity of tree species). The built environment and urban greenery covariates were adjusted in the models. The results indicate that the street tree abundance and species mix are positively associated with pedestrian volume. Species richness is not associated with it. Besides, spatial mismatch is identified between abundance and species mix of street trees in the study area. Hence, to facilitate walking behavior and deliver related health benefits, it is necessary to develop fine-grained measures of street greenery features.
58. Wang, R., Zhang, L., Zhou, S., Yang, L., & Lu, Y.* (2024). The availability and visibility of animals moderate the association between green space and recreational walking: Using street view data. Journal of Transport & Health, 34, 101744. (Click for full text of PDF)

Introduction
Awareness is amounting that understanding the people-animal-environment relationships and further considering it in city design are important to make future cities and society more resilient and sustainable. The presence of green space stimulates recreational walking behaviour. Also, animals in urban outdoor spaces have a restorative effect. However, scant attention has been paid to whether and how green space and animals have a synergistic effect on recreational walking behaviour.
Method
Using survey data collected from 26 neighbourhoods in Guangzhou, China, this study is the first to explore the potential moderating effect of the availability and visibility of animals on the associations between green space and recreational walking behaviour using street view data and a machine learning approach. Multilevel linear and logistic regressions were used for the statistical analysis.
Results
Results showed that the quantity and quality of green space, and availability and visibility of animals were positively associated with recreational walking propensity and duration. Also, the availability and visibility of animals may strengthen the associations between green space and recreational walking behaviour.
Conclusions
Policymakers should consider animal-inclusive green space to maximize the beneficial effect of urban green space on recreational walking.
57. Wei, D., Liu, M., Grekousis, G., Wang, Y., & Lu, Y.* (2023). User-generated content affects urban park use: Analysis of direct and moderating effects. Urban Forestry & Urban Greening, 128158. (Click for full text of PDF)


Urban parks contribute to sustainable urban development by bringing various social and environmental benefits; understanding the factors influencing park use is important for informing evidence-based park design and intervention. Although there are increasing number of studies using user-generated content (UGC) as a proxy of park use, few studies have examined how UGC influences park use. Therefore, we selected 221 urban parks in Guangzhou and Shenzhen, China, with multisource geographic data and collected 153,479 UGC from influential social media platforms. We discovered that UGC sentiment and park use were positively correlated, which was moderated by UGC exposure. In addition, park shape, vegetation and water coverage, land cover mix, parking lot density, and surrounding socioeconomic status, had indirect effects on park use via UGC sentiment. Solid evidence supports that UGC may affect park use because the spurious relationship arising from unmeasured confounders may not be moderated by UGC exposure. We recommend that UGC should be more carefully used as a proxy; its effect should be considered in future studies. In addition, we propose a tentative theoretical framework associating park use, UGC, and other key factors. This research provides a reference for future research and optimizing park use in the modern digital society.
56. Wu, X., Chen W. Y., Zhang, K., & Lu, Y.*, (2023). The dynamic impact of COVID-19 pandemic on park visits: a longitudinal study in the United States. Urban Forestry & Urban Greening, 128154. (Click for full text of PDF)


During the COVID-19 pandemic, people’s park visit pattern has received great attention from both scholars and policy-makers, attributed to parks’ established health benefits and thus serving as an effective strategy to mitigate people’s stress and improve people’s physical and mental health. While burgeoning empirical evidence has been generated, both negative and positive impacts of the pandemic on park visit behaviors have been reported. However, the dynamics of park visits along with the pandemic progress remains underinvestigated. Using locational-based mobile data, this study investigates the longitudinal dynamics of park visits in terms of visiting frequency, travel distance, and time spent within parks across the contiguous United States from January to December 2020. The year-over-year (2019–2020) variations of park visitation patterns are associated with pandemic-relevant variables (i.e., the number of infection cases, and policy stringency index), and the locational characteristics of parks (i.e., “local parks” and “non-local parks” as classified according to ESRI’s US parks dataset). The analytical results reveal that (1) on average, park visit frequency, travel distance, and length of stay reduced since the outbreak of the pandemic; (2) the number of infection cases exerted a negative impact on visit frequency, a positive impact on visitors’ dwelling time, but the inconsistent impact on travel distance in different pandemic periods; (3) the stringency of containment policies negatively affected visit frequency and travel distance, but its impact on park visitors’ dwelling time was inconsistent; and (4) local parks received much fewer visits, even though visitors traveled a longer distance to access some local parks located in peri-urban areas. This study depicts a comprehensive picture of the dynamics of park visitation along with the pandemic progress and sheds light on the ways that parks can aid in recovering from a public health crisis.
55. Wei, D., Lu, Y.*, Wu, X., Ho, H. C., Wu, W., Song, J., & Wang, Y. (2023). Greenspace exposure may increase life expectancy of elderly adults, especially for those with low socioeconomic status. Health & Place, 84, 103142. (Click for full text of PDF)


With an increasing aging population in many cities worldwide, promoting and maintaining the health of elderly individuals has become a pressing public health issue. Although greenspaces may deliver many health outcomes for the elderly population, existing evidence remains inconsistent, partly due to discrepancies in the measure of greenspace and health outcomes. In addition, few studies examined the effect of greenspace exposure on life expectancy at the individual level. Thus, this study comprehensively investigated the association between greenspace exposure and life expectancy among elderly adults in Guangzhou, China, based on the individual-level mortality dataset. The data were analyzed at both the individual level and aggregate level, and two types of buffers (straight-line vs. street-network buffer) were used to define individual greenspace exposure. After controlling for the random effects and multiple types of covariates, we found that 1) elderly individuals with higher greenspace exposure were associated with an increased life expectancy; 2) elderly individuals with lower socioeconomic status benefit more from greenspace (i.e., equigenesis hypothesis); 3) different greenspace measurements lead to different results; 4) greenspace had the highest effects on life expectancy and equigenesis within the street-network buffer distances of 3000 m and 2500 m, respectively. This study underscores the potential health benefits of greenspace exposure on elderly individuals and the importance of provision and upkeep of greenspace, especially among socially disadvantaged groups.
54. Wei, D., Wang, Y.*, Liu, M., & Lu, Y.* (2023). User-generated content may increase urban park use: Evidence from multisource social media data. Environment and Planning B: Urban Analytics and City Science, 23998083231210412. (Click for full text of PDF)
Given the numerous health benefits that urban parks and greenspaces provide, it is critical to grasp the key factors that improve park use. Despite the pervasive impact of user-generated content (UGC) in modern society, little is known about the influence of UGC on park use. Therefore, this study examined the effect of UGC on park use based on 613,858 pieces of UGC related to the 251 urban parks in two metropolitans in China, Guangzhou and Shenzhen. After controlling for the confounders, the hierarchical linear regression revealed that the quantity, rating, sentiment, and exposure were significantly associated with park use. Then, we distinguished three distinct relationships between UGC variables and park use. We proposed that the effects of UGC rating, sentiment, and exposure were more reliable predictors of park use because bidirectional associations may not affect them. Furthermore, we found the heterogeneity in the UGC-park use link by UGC and urban park types. The geotagged UGC had a larger effect size on park use than the keyword UGC. Visits to comprehensive parks were significantly affected by UGC, while visits to community parks were not. This study sheds new light on increasing park use from the perspective of digital information, which benefits future research and policy development in modern society.


53. Zhou, Y., & Lu, Y.* (2023). Spatiotemporal evolution and determinants of urban land use efficiency under green development orientation: Insights from 284 cities and eight economic zones in China, 2005–2019. Applied Geography, 161, 103117. (Click for full text of PDF)


Green development is essential for improving urban land use efficiency (ULUE) as it seeks to optimize resource utilization and minimize waste and pollution. However, a long-term evolution of ULUE and its determinants under the context of green development are less discussed in existing studies. Drawing on remote sensing and statistical data and utilizing the super efficiency slack-based model (SBM) and the geographically and temporally weighted regression (GTWR) model, this study evaluates green development-oriented ULUE and its spatiotemporal associations with determinants across 284 cities and eight economic zones in China from 2005 to 2019. We found that the green development-oriented ULUE in China generally increased in 15 years (from 0.404 to 0.55), with higher levels in coastal and northwestern regions than in central regions. Besides, per capita GDP, investment in technology and science, and degree of openness generally contributed to ULUE (over 75% observations showed positive coefficients), while investment in real estate had a negative impact on ULUE. The impact of industrial structure on ULUE experienced a transition from positive to negative in northern and eastern cities, with the highest coefficient decreasing from 0.194 in 2005 to −0.032 in 2019. Population density contributed to ULUE in southern and northwestern cities during 2005–2010 (coefficients ranging from 0.008 to 0.198), while it negatively influenced ULUE in most cities since 2015 (coefficients ranging from −0.009 to −0.283). The correlation between nighttime light, per capita road, and ULUE showed noticeable south-north differentiation. Our study provides valuable guidelines for Tailor-made strategies of efficient urban management towards sustainable urbanization.
52. Liu, D., Wang, R., Grekousis, G., Liu, Y., & Lu, Y*. (2023). Detecting older pedestrians and aging-friendly walkability using computer vision technology and street view imagery. Computers, Environment and Urban Systems, 105, 102027. (Click for full text of PDF)


As an emerging and freely available urban big data, Street View Imagery (SVI) has proven to be a useful resource to examine various urban phenomena in human behavior, the built environment and their interactions. However, due to technical limitations, previous studies often focused on general pedestrians and ignored certain population subgroups such as older adults. In this study, we develop an innovative method for detecting older pedestrians using SVI. We adopted transfer learning to train a model which can accurately detect older pedestrians on SVI with an accuracy of 87.1%.
Using Hong Kong as a case study, we created a dataset consisting of 72,689 street view panoramas and detected 7763 older pedestrians and 29,231 non-older pedestrians. We further visualized the distribution of detected older pedestrians and found a significant spatial discrepancy between older pedestrians and residential population of older adults. To account for this spatial discrepancy, this study proposed a novel index to assess pedestrian demand and walking environment based on the ratio of the number of pedestrians and the residential population. We also found pedestrian demand assessed with this index has a stronger correlation with the built environment compared with population-level travel survey. This novel approach can be used to assess pedestrian demand for older adults, as well as aging-friendly walking environment.
51. Yang, H., Lu, Y.*, Wang, J., Zheng, Y., Ruan, Z., & Peng, J. (2023). Understanding post-pandemic metro commuting ridership by considering the built environment: A quasi-natural experiment in Wuhan, China. Sustainable Cities and Society, 96, 104626. (Click for full text of PDF)

The COVID-19 pandemic has had a significant impact on metro commuting ridership. However, the exact magnitude and spatial and temporal characteristics of the impact remain unclear. In this study, we explored the impact of the COVID-19 outbreak on metro commuting ridership in Wuhan, where the novel virus was first reported. The results of interrupted time-series (ITS) analysis showed that metro commuting ridership sharply dropped in the short term under the impact of the outbreak in the epicenter, rebounded rapidly as the pandemic eased, and returned to pre-pandemic levels in six months. Furthermore, there was a noticeable spatial heterogeneity in the rebound. Urban centers, especially job-rich areas, recovered faster than other areas. In addition, the number of residents, number of bus stops, number of enterprises around a metro station, and being a transfer station had a positive effect on metro ridership, while street length, number of restaurants, and number of metro exits had a negative effect. These findings may help local governments and metro managers develop sustainable metro operations and infection prevention policies to better cope with the impact of the pandemic and beyond.
