
PUBLICATIONS LIST
*Corresponding author
20. Wang, R., Lu, Y.*, Wu, X., Liu, Y., & Yao, Y. (2020). Relationship between eye-level greenness and cycling frequency around metro stations in Shenzhen, China: A big data approach. Sustainable Cities and Society, 59, 102201. (Click for full text of PDF)


Better bicycle-transit integration improves the efficiency and sustainability of public transportation systems in urban areas. Urban greenness around metro stations may affect the use of cycling to or from metro stations. However, the evidence for the association between urban greenness and cycling behaviors is inconclusive. In addition, few studies have been conducted in developing countries, such as China, which enjoyed the reputation of cycling nation until the late 1990s and witness a big comeback of cycling in the last several years. This study aimed to explore the relationship between eye-level greenness and cycling behaviors around metro stations in Shenzhen, China, based on free-floating bicycle data and street-view image data. The results indicate that eye-level greenness was positively associated with cycling frequency on weekdays and on weekends within three buffer sizes around metro stations (500-m, 1000-m, and 1500-m). The effect of eye-level greenness on cycling frequency was greater on weekends than on weekdays. Our findings suggest that providing sufficient and visible greenery along streets and cycling lanes around metro stations may promote cycling use and bicycle-transit integration.
19. Yang, Y., Lu, Y.*, Yang, L., Gou, Z., & Zhang, X. (2020). Urban greenery, active school transport, and body weight among Hong Kong children. Travel behaviour and society, 20, 104-113. (Click for full text of PDF)
Children who are overweight or obese are at a higher risk of several diseases and are more likely to be overweight or obese in adulthood. Physical inactivity among children and adolescents is one of the major causes of the prevalence of overweight and obesity problems, and hence promoting physical activity, especially active school transport (AST), is a public health priority. Previous studies have provided evidence that urban greenery may promote physical activity and improve body weight outcomes among children. However, the relationships reported between these factors are inconsistent, partly due to the use of different measures of urban greenery. In the present study, we assessed different dimensions of urban greenery using three measures: number of parks; the Normalized Difference Vegetation Index (NDVI) based on satellite imagery; and street greenness based on Google Street View images. Multilevel regression analysis and structural equation modeling were conducted to investigate the complex relationships among urban greenery, AST, and body weight for 1,148 primary school students in Hong Kong. Overall, children attending schools with greener surrounding areas were more likely to engage in AST and had lower body mass index (BMI). In addition, AST partially mediated the impact of urban greenery on BMI. The findings demonstrate the importance of greenery around schools for children’s body weight status. They also offer public health and planning guidance on how to address overweight and obesity problems among children.


18. Chen, L., Lu, Y.*, Sheng, Q., Ye, Y., Wang, R., & Liu, Y. (2020). Estimating pedestrian volume using Street View images: A large-scale validation test. Computers, Environment and Urban Systems, 81, 101481. (Click for full text of PDF)
Pedestrian volume is an important indicator of urban walkability and vitality. Hence, information on pedestrian volumes of different streets is indispensable for creating healthy, pedestrian-oriented cities. Pedestrian volume data have traditionally been collected through field observations, which has many methodological limitations, e.g. time-consuming, labor-intensive, and inefficient.
Assessing pedestrian volume automatically from Street View images (SVIs) with machine learning techniques can overcome such limitations because this approach offers a wide geographic reach and consistent image acquisition. Nevertheless, this new method has not been rigorously validated, and its accuracy remains unclear.
In this study, we conducted a large-scale validation test by comparing pedestrian volume extracted from SVIs with the results from field observations for more than 700 street segments in Tianjin, China. A total of 4507 sampling points along these street segments were used to collect SVIs.
The results demonstrated that using SVIs with machine learning techniques is a promising method for estimating pedestrian volumes with a large geographic reach. Automated pedestrian volume detection could achieve reasonable (Cronbach's alpha ≥0.70) or good (Cronbach's alpha ≥0.80) levels of accuracy. It is worth noting that various factors of SVIs and street segments may affect the accuracy. SVIs with higher image quality, larger image size, and collection times closer to the targeted periods produced more accurate results. The automated method also worked better in areas with high pedestrian volume and high street connectivity.


17. Yang, Y., He, D., Gou, Z., Wang, R., Liu, Y.*, & Lu, Y. (2019). Association between street greenery and walking behavior in older adults in Hong Kong. Sustainable Cities and Society, 51, 101747. (Click for full text of PDF)
Built environment interventions, such as creating green and walkable neighborhoods have increasingly been recognized as an effective approach to promote physical activity and health for older adults. However, evidence of the associations of urban greenery and older adults’ physical activity is still inconclusive, partially due to the difficulty to estimate eye-level urban greenery exposure. To address this gap, we assessed street greenery by Google Street View (GSV) images with machine learning techniques and associated it with walking behavior for 10,700 and 1083 Hong Kong older adults (aged 65 or above) respectively. Neighborhood socioeconomic status, individual factors, and other built environment characteristics were controlled for in the analysis. We found that street greenery assessed by GSV was positively associated with both the odds of engaging in walking and total walking time of the older adults. Our findings suggest that urban planners and policymakers should maximize residents’ greenery exposure by considering the accessibility and visibility of urban greenery from pedestrian and human-scale perspectives.


16. Zang, P., Lu, Y.*, Ma, J., Xie, B., Wang, R., & Liu, Y. (2019). Disentangling residential self-selection from impacts of built environment characteristics on travel behaviors for older adults. Social Science & Medicine, 238, 112515. (Click for full text of PDF)


In the context of population ageing in many developed and developing countries, encouraging active transport behaviors of older adults, is a key public health priority. However, many cross-sectional studies assessing the impact of built environment characteristics on travel behavior fail to address residential self-selection bias, and hence the causal relationship is uncertain. A large-scale public housing scheme provided this study with a unique research opportunity to distinguish residential self-selection from the effects of built environment characteristics on the travel behaviors of older adults (N = 13,468 and 3,961 in two analyses respectively) in Hong Kong, because public housing residents have little freedom to choose their residential locations. The results showed that the elderly living in public housing estates generally have fewer trips, shorter overall travel times and distances, and fewer motorized trips including those by rail or private car than those living in private housing estates. In addition, the results for walking, walking times, numbers of trips, and travel distance for elderly people in public and private housing all exhibited markedly different associations with built environment characteristics. Strength of built environment-travel behavior associations dropped by approximately 30–50% after controlling for the effect of residential self-selection. The results indicate that both built environment characteristics and residential self-selection affect travel behaviors.
15. Lu, Y.*, Sun, G., Gou, Z., Liu, Y., & Zhang, X. (2019). A dose–response effect between built environment characteristics and transport walking for youths. Journal of Transport & Health, 14, 100616. (Click for full text of PDF)


Background
A lack of physical activity can lead to long-term health problems for youths (aged 5–18) worldwide. Built environment characteristics are increasingly being recognized as important factors affecting transport walking, a reliable source of overall physical activity for youths. However, the relationship between built environment characteristics, especially residential density, and youths’ walking for transport purposes (transport walking) remain largely inconclusive, due to limited variation in built environment variables and an assumption of linear association.
Methods
In this study, we explore the dose-response relationship between built environment characteristics and transport walking for youths in Hong Kong, a city with large variations in residential density. Detailed transport walking behaviors, such as the number of trips and walking duration, were extracted from the 2011 Hong Kong Travel Characteristics Survey (N = 13,287; aged 5–18). Neighborhood socioeconomic status, age, gender, household income, and household vehicle ownership were controlled in the generalized additive mixed models (GAMMs) of the built environment-transport walking associations.
Results
We found inverted U-shaped associations between population density and both the odds and total minutes of transport walking. Population density within 30,000–60,000 persons/km2 is optimal to promote transport walking for youths. In addition, the number of recreational facilities and retail shops were positively associated with likelihood of engaging in transport walking, and number of bus stops was negatively associated with transport walking.
Conclusion
We add new empirical evidence on the significant and non-linear relationship between urban density and transport walking. Although increasing urban density in already densely developed cities may not be an effective intervention strategy to increase transport walking in youths, such strategy may still be effective in other less dense areas.
14. Yang, Y., Wu, X., Zhou, P., Gou, Z., & Lu, Y.* (2019). Towards a cycling-friendly city: An updated review of the associations between built environment and cycling behaviors (2007–2017). Journal of Transport & Health, 14, 100613. (Click for full text of PDF)


Introduction
Cycling behavior has recently attracted great research attention as an important type of physical activity and sustainable mode of transportation. In addition, cycling provides other environmental benefits, such as reducing air pollution and traffic congestion. Various built environment factors have been demonstrated to be associated with the popularity of cycling behaviors. However, the most recent built environment cycling reviews were conducted nearly 10 years ago, and these reviews reached no clear consensus on which built environment factors are associated with which domain of cycling behaviors. To determine the crucial features of a cycling-friendly city, it is therefore necessary to conduct a review based on empirical studies from the last decade (2007–2017).
Methods
Thirty-nine empirical studies published in peer-reviewed journals between 2007 and 2017 were retrieved and reviewed. The results were summarized based on built environment factors and four domains of cycling behaviors (transport, commuting, recreation, and general). Weighted elasticity values for built environment factors were calculated to estimate effect sizes.
Results
We found consistent associations with large effect sizes between street connectivity and cycling for commuting and transport. The presence of cycling paths and facilities was found to be positively associated with both commuting cycling and general cycling. However, the effects of land-use mix, availability of cycling paths to non-residential destinations, and terrain slope on cycling behaviors remained weak. The effects of urban density and other built environment factors are mixed.
Conclusions
This review has demonstrated that street connectivity and the presence of cycling paths and facilities are the two most significant built environment factors that may promote cycling behaviors. With the emergence of advanced measurement methods for both the built environment and cycling behaviors, further studies may overcome current research limitations and provide robust evidence to support urban planning and public-health practice.
13. Wang, R., Yuan, Y., Liu, Y., Zhang, J., Liu, P., Lu, Y.*, & Yao, Y*. (2019). Using street view data and machine learning to assess how perception of neighborhood safety influences urban residents’ mental health. Health & place, 59, 102186. (Click for full text of PDF)


Previous studies have shown that perceptions of neighborhood safety are associated with various mental health outcomes. However, scant attention has been paid to the mediating pathways by which perception of neighborhood safety affects mental health. In addition, most previous studies have evaluated perception of neighborhood safety with questionnaires or field audits, both of which are labor-intensive and time-consuming. This study is the first attempt to measure perception of neighborhood safety using street view data and a machine learning approach. Four potential mediating pathways linking perception of neighborhood safety to mental health were explored for 1029 participants from 35 neighborhoods of Guangzhou, China. The results of multilevel regression models confirm that perception of neighborhood safety is positively associated with mental health. More importantly, physical activity, social cohesion, stress and life satisfaction mediate this relationship. The results of a moderation analysis suggest that the beneficial effects of physical activity and social cohesion on mental health are strengthened by a perception of neighborhood safety. Our findings suggest the need to increase residents’ perception of neighborhood safety to maintain mental health in urban areas of China.
12. Lu, Y.*, Gou, Z., Ye, Y., & Sheng, Q. (2019). Three-dimensional visibility graph analysis and its application. Environment and Planning B: Urban Analytics and City Science, 46(5), 948-962. (Click for full text of PDF)
Graph-based visibility analysis, developed from space syntax and social network theory, embraces mutual visibility between locations in a spatial system. It helps designers and researchers to decode spatial cognition and behavior, but methodological constraints limit its application to two-dimensional floor plans. In this study, we propose a new visibility graph analysis that can be used in three-dimensional built environments, such as multilevel atrium buildings or urban environments with canopies or overpass bridges. Furthermore, we draw a distinction between a generic visibility graph and a targeted visibility graph. In the former, an occupiable location is considered as both the origin and target of visibility lines. In the latter, we further take into account the visible space or specific targets in a system. Visible locations are spaces people can see but cannot necessarily physically occupy. With this differentiation, the visibility graph system is more amenable to new applications in three-dimensional architectural and urban design while retaining a mapping back to the original two-dimensional visibility graph method through the generic visibility graph. Four examples illustrate the application of the proposed visibility graph analysis in complex three-dimensional building and urban environments.


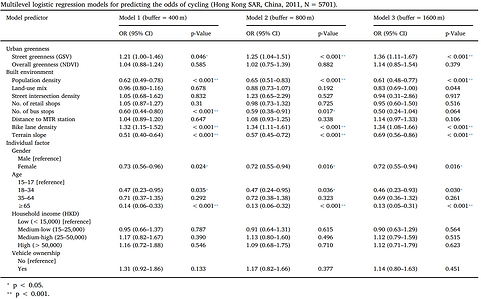
11. Lu, Y.*, Yang, Y., Sun, G., & Gou, Z. (2019). Associations between overhead-view and eye-level urban greenness and cycling behaviors. Cities, 88, 10-18. (Click for full text of PDF)
Cycling is one type of physical activities with documented health and environmental benefits. Little consensus has been reached about the impacts of urban greenness on cycling behavior because of the widely varying estimation techniques, especially at street scale. We objectively measured the urban greenness in two ways: overhead-view greenness by Normalized Difference Vegetation Index (NDVI) and eye-level street greenness by Google Street View (GSV) images. Multilevel logistic regression models were used to examine the association between urban greenness and the odds of cycling (versus not cycling) for 5701 Hong Kong participants after controlling activity-influencing built environment and individual-level covariates. We found the odds of cycling were positively associated with eye-level street greenness but not with overhead-view greenness across three buffer zones: 400 m, 800 m and 1600 m. In addition, the odds of cycling were negatively associated with population density, number of bus stops, and terrain slope, while positively associated with bike lane density. To build a cycling-friendly city, planners and designers might need to pay more attention to improve citizens' daily exposure to urban greenness, instead of traditional greenspace indices such as greenspace area or number of parks. The GSV technique is a novel and reliable method for measuring eye-level urban greenness with potential usage in further healthy city studies.